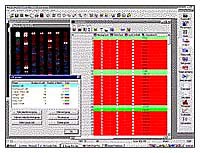
- processing에따른 Automatic rotation, grid, subgrid, spot finding.
- templete에서 자동적으로 이루어지는 grid, subgrid 및 spots 정렬.
- negative control, 부적절한 spot무시, 신호제어(housekeeping genes)
및 사용자정의 기준에 따른 그룹화.
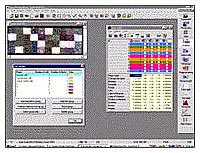
- 반복적인 분석을 위한 Binning of spots.
- 일반 영상 및 reference spot(zero order, bilinear, biquadratic,
bicubic polynomial fit)에서부터 특정도형주변이나
가장자리(with offset, width, erosion, filter control)의
background noise제거 및 characterize 에 대해 입증된
심도있는 이미지분석기술.
- mean, median, reference spots에 의한 표준화.
- 휘도 및 공간측도 설정 (Intensity and spatial calibration)
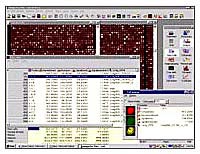
- 정보해석을 위한 Interactive graphics 과 data table.
- 각각의 spot,또는 전체spot에 대한 사용자의 선택적 data선별: mean, median, min,
max, range, sum,
standard deviation, ratio (유전자발현과 같이 두이미지가 그룹화되어
있을 경우)
- Experiment definition, storage and recall (with associated
images and information)
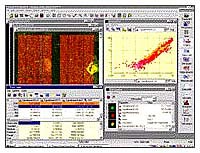
- 전체 spot 혹은 일련의 spot 집단의 image에대한 Histogram display.
- 두개의 image로부터 얻은 결과의 Scatterplot 제시(with interactive graphic
selection).
- 이미지 그룹에서 각각의 spot에대해 상세한 정보를 지닌 Interactive cell window
제시. (e.g. Cy3, C5, ratio)
  
* Click on image for more details, 59k * Click on image for more details, 65k * Click on image for more details, 65k
  
* Click on image for more details, 65k * Click on image for more details, 52k * Click on image for more details, 52k
|